ArtVis - Exploring Information Through Advanced Visualisation Techniques
The ArtVis project investigates advanced visualisation techniques in combination with a tangible user interface to explore a large source of information (Web Gallery of Art) about European painters and sculptors from the 11th to the mid-19th century. Specific graphical and tangible controls allow the user to explore the vast amount of artworks based on different dimensions (faceted browsing) such as the name of the painter, the museum where an artwork is located, the type of art or a specific period of time. The name ArtVis reflects the fact that we bring together artworks and the field of Information Visualisation (InfoVis) in order to achieve a playful and highly explorative user experience. Our ArtVis application enables the efficient browsing and exploration of data based on advanced visualisation techniques and futher helps users to get a broader understanding of the collection of artworks.
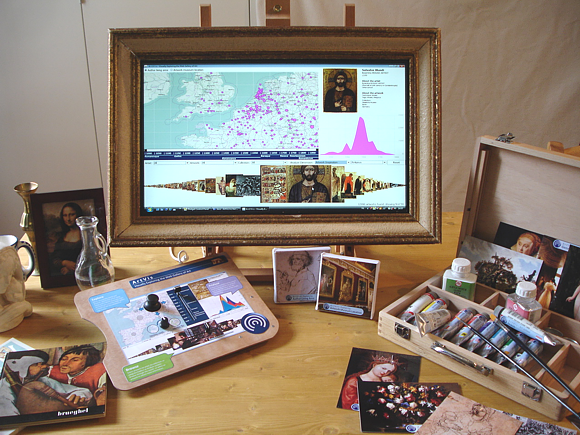
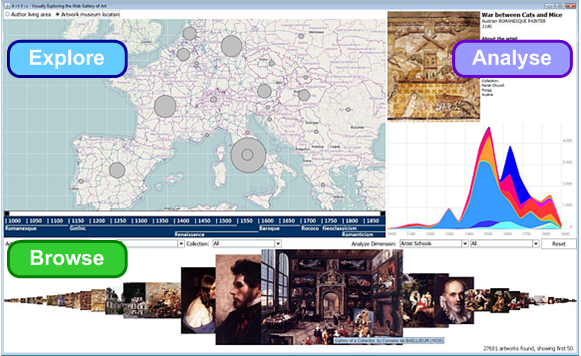
The ArtVis visualisation includes three main components to Explore, Analyse and Browse the information. Based on the Explore component, the user can perform geographical queries to get a broader insight into the field of medieval artworks. The results are displayed on a map and allow for further exploration by panning and zooming interaction. A second component, the Analyse component, is used to analyse the data and provide the user a better understanding about the evolution of artistic production by visually analysing the dimensions of the data over time. Last but not least, the Browse component allows the user to browse through individual artworks resulting from a specific query. By selecting an individual artwork, the user gets a detailed picture together with a full description of the artwork. The most interesting aspect of this advanced visualisation technique is the fact that these three Explore, Analyse and Browse components are based on the same dataset and can be combined to formulate more complex queries. For example, when selecting a dimension in the Analyse component (e.g. an art school or a form of art), the Explore and Browse components are automatically updated to show only relevant pieces of art. On the other hand, when selecting a city, country or continent from the Explore component, the Browse component gets automatically updated. In the following, we list a number of typical questions that can be answered based on ArtVis and its three visualisation and interaction components:
- When was the Flemish school at its peak?
- Which was the most active Italian city during the Renaissance?
- Illumination is the art of decorating books. What can we say about its evolution over time?
- I which museum can we find the geographer by Johannes Vermeer?
- One of the paintings in the Groeninghe Museum in Bruges, Belgium is showing a very cruel scene. What is the title of this artwork?
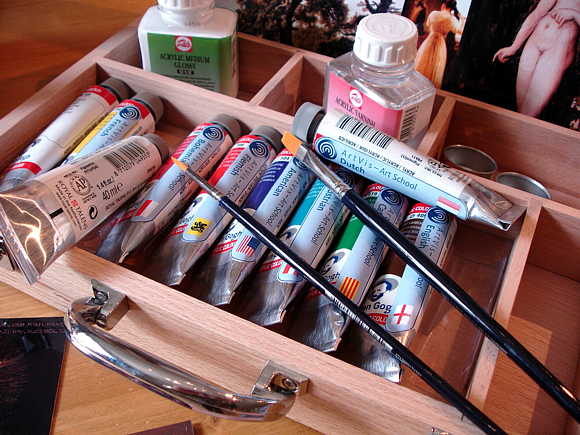
To offer an innovative interaction with ArtVis that goes beyond standard keyboard and mouse interaction and is also attractive for museum visitors who are not familiar with computers, we decided to offer a tangible user interface (TUI). Our solution is based on the Phidgets toolkit and uses a number of sensors and physical interface components including small joysticks, physical sliders as well as an RFID reader. All these components are mounted on a physical painter’s palette (control) which can be used to interact with the information. At the same time, the painter's palette offers a small user guide which results in a self-explanatory tangible user interface. There are various physical objects (with an attached RFID tag) forming part of the tangible ArtVis interface, which can be used to filter the information by just holding them close to the painter’s palette.
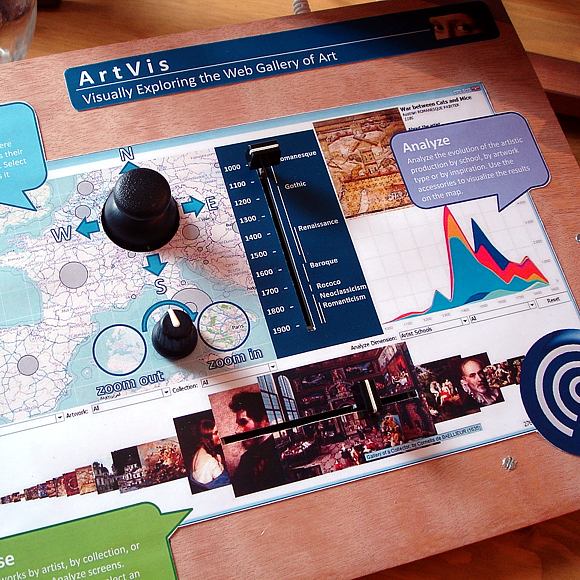
For example, the evolution of a specific art school can be selected by placing one of the RFID-tagged paint tubes representing the corresponding art school on the painter's palette. The Analyze component then shows the evolution of this art school over time, the Explore visualisation provides a geographical overview and the Browse component outlines a selection of artworks from this school. The production of an artwork can be explored by selecting one of the ornamentals. For instance, the selection of the snmall ceramic jugwill show the evolution of pottery whereas the small statue shows the evolution of sculpture. Furthermore, there are various postcards to select an artist inspiration. The user can also switch between the artist's living area and the location of the museums where the pieces of art are currently located by using two small paintings. Last but not least, specific RFID tags for individual authors and museums can also be integrated in books on these subjects. For example, a book about the Louvre museum will show the locations from where the artworks that are exhibited in the Louvre in Paris come from in the Explore visualisation as well as images of the pieces of art that are located in the Louvre in the Browse component.
The ArtVis application has been evaluated with a number of users and we got some very promising preliminary results. In the near future, we might collaborate with some museums to make the ArtVis application accessible to a wider audience and get some feedback from users. Of course, the presented visualisation techniques and tangible interaction cannot only be used for artworks and we plan to build similar interfaces for enhanced data exploration in other domains. Last but not least, we are currently investigating a general tangible query language (TQL) which can then be used by the developer and designer of new tangible user interfaces as well as by the end user who wants to compose and materialise more complex queries in a stepwise manner.
Related Publications
Status: Finished